
Elevate Your Call Center Game: KPIs You Need to Know
Running a successful home service business requires top-notch customer service. Your call center is key, and tracking the right Key Performance Indicators (KPIs) is crucial for maximizing efficiency and customer satisfaction. This listicle provides six essential call center KPI examples to help optimize your team's performance and boost profits. Learn how to measure First Call Resolution (FCR), Average Handle Time (AHT), Customer Satisfaction Score (CSAT), Net Promoter Score (NPS), Service Level/Response Time, and Agent Occupancy Rate. Understanding these KPIs empowers you to identify areas for improvement, enhance customer experience, and ultimately grow your business.
1. First Call Resolution (FCR)
First Call Resolution (FCR) is a crucial call center KPI example for any home service business. It measures the percentage of customer inquiries or issues resolved during the initial interaction, eliminating the need for follow-up calls or transfers. For home service businesses, this could mean resolving scheduling conflicts, addressing billing questions, or troubleshooting service issues on the first call. This metric is a powerful indicator of both call center efficiency and customer satisfaction, as resolving issues promptly significantly enhances the customer experience while simultaneously reducing operational costs. A high FCR demonstrates your commitment to efficient service and builds trust with your customers.

FCR is typically expressed as a percentage. It’s calculated by dividing the number of calls resolved on the first contact by the total number of calls received. Measurement is often conducted through post-call surveys or by tracking repeat calls related to the same issue. Industry benchmarks for FCR typically range from 70-75%, offering a target for home service businesses to aim for. Achieving a high FCR can differentiate your business from competitors by showcasing your commitment to prompt and efficient service.
Features:
- Expressed as a percentage.
- Calculated by (Number of calls resolved on first contact) / (Total calls).
- Measured via post-call surveys or repeat call tracking.
- Industry benchmark: 70-75%.
Pros:
- Directly correlates with customer satisfaction: Home service customers value quick and effective solutions. A high FCR reflects positively on your business's responsiveness.
- Reduces operational costs: Fewer repeat calls mean less agent time spent on the same issue, reducing labor costs and freeing up resources.
- Improves agent efficiency and productivity: Agents can handle more calls effectively when equipped to resolve issues on the first contact.
- Identifies training opportunities and knowledge gaps: A low FCR can pinpoint areas where agents require additional training or resources.
Cons:
- Definition of 'resolved' can be subjective: What constitutes a "resolved" issue may vary, requiring careful definition within your business.
- Some complex issues legitimately require multiple interactions: Certain home service issues, such as complex repairs or installations, may necessitate multiple visits or follow-ups.
- Can encourage agents to rush through calls: Agents might prioritize closing calls quickly over providing thorough solutions to artificially inflate FCR.
- May not account for quality of resolution: A quick resolution doesn't always equate to a satisfactory one. Quality assurance is essential.
Examples:
- Amazon achieved over 80% FCR by implementing comprehensive knowledge bases and empowering agents with decision-making authority. This approach can be replicated in a home service context by providing agents with readily accessible information on common issues, pricing, and scheduling.
- Zappos improved their FCR to 75% by removing time constraints on calls and prioritizing complete resolution. While time management is crucial, empowering agents to spend the necessary time on a call can significantly boost FCR.
Tips for Home Service Businesses:
- Establish a clear definition of "resolved": Define what constitutes a successful first-call resolution specific to your services.
- Implement robust knowledge management systems: Equip agents with easy access to information on common issues, service protocols, and pricing.
- Empower agents with appropriate authority: Give agents the autonomy to make decisions and resolve issues without excessive escalation.
- Consider measuring FCR over 24-48 hour periods: This accounts for resolutions that might require a short follow-up action.
- Segment FCR by issue type: This helps identify specific problem areas and tailor training or process improvements.
Popularized By: Service Quality Measurement Group (SQM), International Customer Management Institute (ICMI)
FCR deserves a prominent place on this list of call center KPI examples because it directly impacts both customer satisfaction and operational efficiency, two critical factors for success in the competitive home service industry. By focusing on improving FCR, home service businesses can enhance their reputation, reduce costs, and foster stronger customer relationships.
2. Average Handle Time (AHT)
Average Handle Time (AHT) is a crucial call center KPI example for home service businesses aiming to optimize operational efficiency. It measures the total duration of a customer interaction, encompassing talk time, hold time, and any necessary after-call work, such as updating customer records or scheduling appointments. AHT provides valuable insights into how quickly your team handles customer inquiries and resolves issues. It's calculated by dividing the total handle time of all calls by the number of calls handled. While a lower AHT generally suggests efficiency, it's essential to balance speed with delivering exceptional customer service. For home service businesses, this balance is particularly important as inquiries often involve complex scheduling, technical questions, or urgent requests.
AHT is typically measured in seconds or minutes and can be broken down by call type (e.g., scheduling, billing, technical support), agent, or time period. Industry benchmarks for AHT vary by sector. While retail might aim for 3-5 minutes, technically-focused home service businesses could see AHTs closer to the 10-15 minute range for complex issues. This KPI deserves a spot on this list because it directly impacts staffing needs, cost per contact, and ultimately, customer satisfaction.
Features and Benefits:
- Comprehensive Measurement: Includes all aspects of call handling, providing a holistic view of efficiency.
- Granular Analysis: Can be segmented to identify specific areas for improvement.
- Actionable Insights: Helps pinpoint bottlenecks in processes and training needs.
- Forecasting and Capacity Planning: Enables accurate predictions of staffing requirements based on call volume and complexity.
Pros:
- Cost Reduction: Optimizing AHT can significantly reduce staffing costs and cost per contact.
- Process Improvement: Identifies inefficiencies in call handling processes.
- Enhanced Resource Allocation: Facilitates effective capacity planning and resource allocation.
- Targeted Training: Highlights areas where agents require additional training or support.
Cons:
- Potential for Rushed Service: Overemphasis on AHT can lead to agents rushing calls and compromising customer satisfaction.
- Conflict with Quality Metrics: May negatively impact other important metrics like First Call Resolution (FCR) if agents prioritize speed over thoroughness.
- Varied Call Complexity: Not all calls have the same level of complexity, making a blanket AHT target ineffective.
- Agent Pressure: Can create undue pressure on agents, potentially leading to burnout.
Examples of Successful Implementation:
- American Express reduced their AHT by 10% while simultaneously improving customer satisfaction by implementing improved CRM systems and agent desktop tools, streamlining access to customer information and reducing time spent searching for data.
- TD Bank adopted a segmented AHT approach based on call complexity. This allowed them to set realistic targets for different types of inquiries, leading to a 15% improvement in both efficiency and customer satisfaction scores.
Actionable Tips for Home Service Businesses:
- Segmented AHT Targets: Establish different AHT targets based on call types (e.g., scheduling a service call vs. a billing inquiry). Account for the inherent complexity of technical support calls common in the home services industry.
- Minimize Hold Times: Focus on reducing hold times by optimizing call routing and ensuring adequate staffing levels, especially during peak hours. Consider implementing callback options.
- Improve System Response Times: Invest in robust CRM and phone systems that offer quick access to customer information and minimize delays caused by slow loading times.
- Call Recording and Analysis: Utilize call recording and analysis tools to identify areas where agents can improve their efficiency without sacrificing service quality.
- Balance AHT with Quality: While AHT is important, always prioritize customer satisfaction. Balance AHT goals with other key metrics like CSAT and FCR.
- Skills-Based Routing: Implement skills-based routing to ensure that calls are directed to the most qualified agent, reducing the need for transfers and improving resolution times.
When and Why to Use AHT:
AHT should be used continuously to monitor and improve call center performance. It's particularly relevant for home service businesses experiencing high call volumes, long wait times, or escalating costs per contact. By tracking and analyzing AHT, home service businesses can identify opportunities to streamline operations, improve customer service, and boost their bottom line. This KPI is popularized by industry experts such as Brad Cleveland (Call Center Management on Fast Forward) and Gartner's customer service research.
3. Customer Satisfaction Score (CSAT)
Customer Satisfaction Score (CSAT) is a key performance indicator (KPI) that measures how satisfied customers are with a specific interaction, service, or product. In the context of call centers, which are often the primary point of contact for home service businesses, CSAT is crucial for understanding how your customers perceive the quality of your services and the performance of your agents. It is typically measured through post-call surveys asking customers to rate their satisfaction on a numerical scale (e.g., 1-5 or 1-10) or using emoji-based feedback systems. This direct feedback provides invaluable insights into areas for improvement and helps identify strengths within your customer service operations. For home service businesses, where reputation and customer loyalty are paramount, tracking CSAT is essential for sustained growth and success.
CSAT is usually expressed as a percentage of positive responses. For instance, if 8 out of 10 customers provide a positive rating (e.g., 4 or 5 on a 5-point scale), the CSAT score would be 80%. It's important to remember that CSAT can be measured at different levels: interaction (e.g., a single call), journey (e.g., the entire process from booking to service completion), or relationship (e.g., the overall customer experience with your business). This flexibility allows you to pinpoint specific areas needing attention within your customer journey. A typical industry benchmark for call centers ranges from 75-85%, providing a target for home service businesses to strive for.
Why CSAT Deserves its Place in the List of Call Center KPI Examples: For home service businesses, customer satisfaction is directly linked to repeat business and referrals. A high CSAT signifies that your customers are happy with the service they received, increasing the likelihood they will choose your company again for future needs and recommend you to their network. Therefore, including CSAT as a key metric allows you to monitor and improve this vital aspect of your business.
Features and Benefits: Using simple rating scales makes it easy for customers to understand and complete the surveys, leading to higher response rates. Furthermore, the ability to tie CSAT scores to specific interactions or agents facilitates targeted coaching and performance improvement initiatives. Analyzing CSAT trends over time helps identify recurring issues and track the effectiveness of implemented solutions. Including open-ended feedback questions within the survey can offer rich qualitative insights into customer experiences.
Pros:
- Provides direct customer feedback.
- Easy for customers to understand and complete.
- Can be tied to specific interactions or agents.
- Allows for trend analysis over time.
- Can include open-ended feedback for qualitative insights.
Cons:
- Subject to response bias (typically only very satisfied or very dissatisfied customers respond).
- Contextual factors outside agent control can influence scores.
- High volume of surveys can lead to survey fatigue.
- Cultural differences can affect how ratings are given.
Examples of Successful Implementation: Companies like Discover Financial Services have achieved a remarkable 92% CSAT by implementing AI-assisted coaching for their agents. Similarly, HubSpot improved their CSAT from 82% to 94% by leveraging sentiment analysis and real-time feedback systems. These examples highlight the potential of CSAT optimization.
Actionable Tips for Home Service Businesses:
- Keep surveys short and relevant: Focus on questions directly related to the specific interaction, such as the scheduling process, technician's professionalism, and the quality of service.
- Ask for CSAT immediately after the interaction: This increases the accuracy of feedback as the experience is still fresh in the customer's mind.
- Combine with verbatim comments: Encourage customers to provide detailed feedback alongside their numerical rating to understand the reasoning behind their score.
- Segment CSAT by issue type, agent, and customer segment: This allows for a more granular analysis and identification of specific areas for improvement.
- Close the feedback loop: Follow up on negative scores to address customer concerns and demonstrate your commitment to their satisfaction. This is crucial for turning a negative experience into a positive one.
- Use speech analytics (if available): Correlate conversation patterns with CSAT scores to identify areas where agent training or process improvement can be implemented.
By prioritizing CSAT and implementing these strategies, home service businesses can significantly enhance customer satisfaction, leading to increased customer loyalty, positive word-of-mouth referrals, and ultimately, business growth.
4. Net Promoter Score (NPS)
Net Promoter Score (NPS) is a crucial call center KPI example that gauges customer loyalty and their likelihood to recommend your services. It works by asking a simple question: "On a scale of 0 to 10, how likely are you to recommend [Your Company Name] to a friend or colleague?" Based on their responses, customers are categorized into three groups: Promoters (9-10), Passives (7-8), and Detractors (0-6). Your NPS is then calculated by subtracting the percentage of Detractors from the percentage of Promoters, resulting in a score ranging from -100 to +100. For call centers, NPS provides valuable insights into how service quality impacts customer loyalty and, ultimately, business growth.
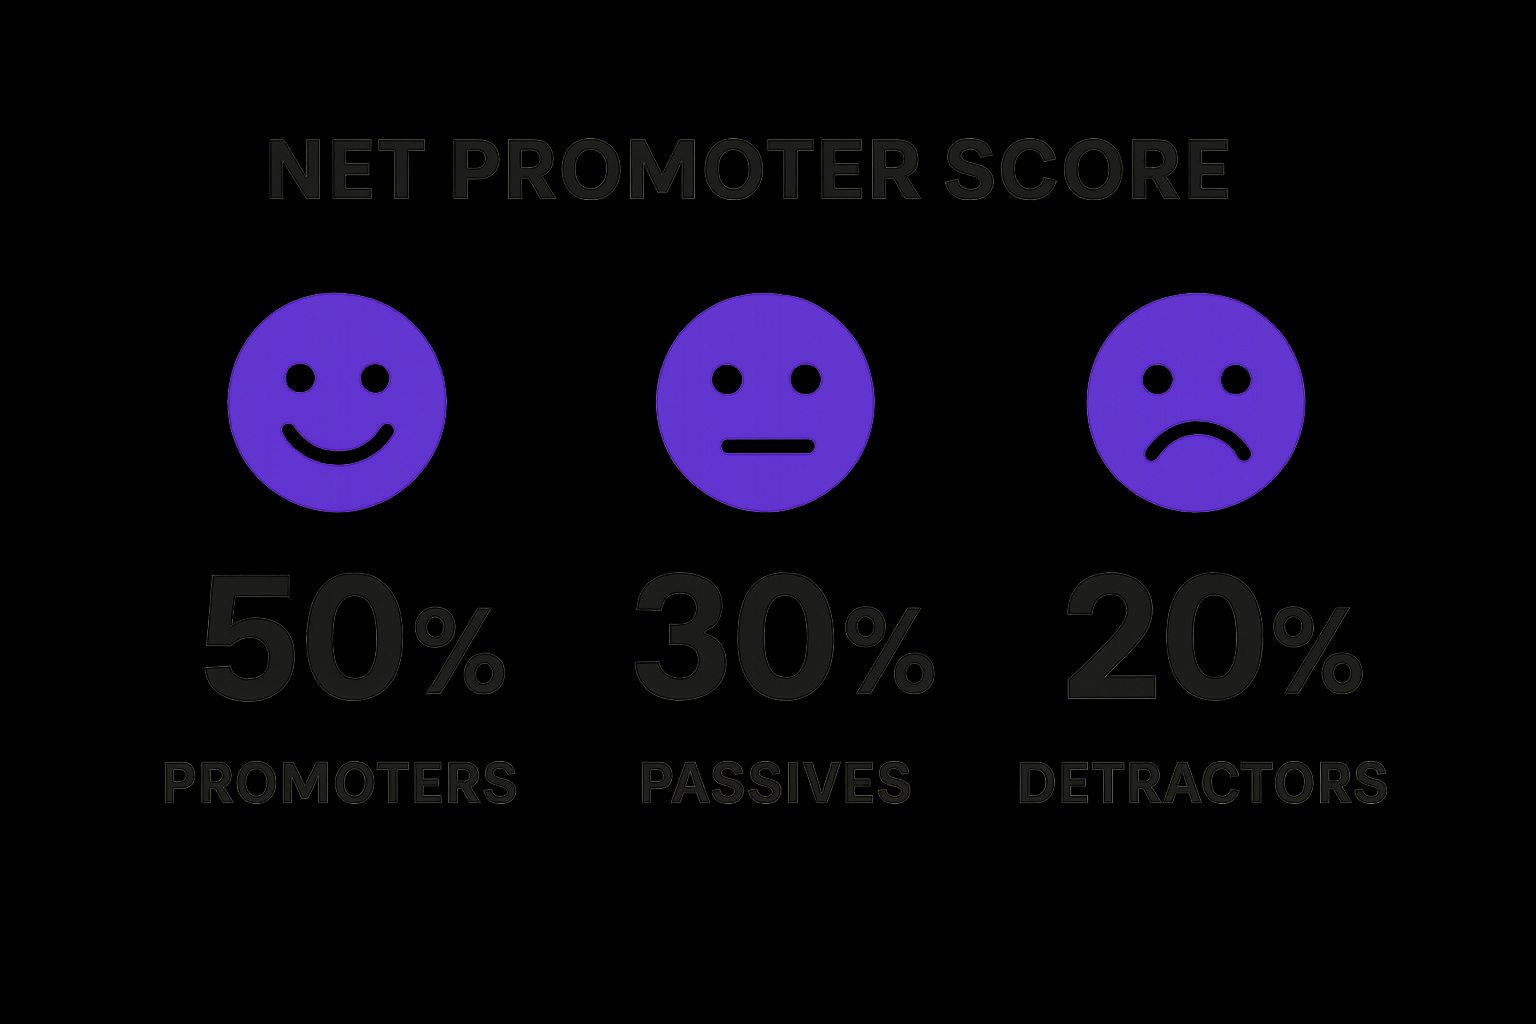
The infographic visually represents the distribution of Promoters, Passives, and Detractors, highlighting the calculation of the NPS and its correlation with customer behavior. For instance, it visualizes how a higher percentage of Promoters leads to a higher NPS, translating into increased customer retention, positive word-of-mouth referrals, and ultimately, business growth. Conversely, a larger percentage of Detractors signifies negative word-of-mouth and potential churn.
This single-question format is easy to implement and understand, making it a powerful tool for home service businesses. Features of NPS include its -100 to +100 range, its simplicity, and its flexibility to be measured at both transactional (after a specific call) and relationship (overall experience) levels. While industry benchmarks vary, a good NPS typically falls between +30 and +50, with exceptional scores reaching +70 and above. For home service providers, where reputation and referrals are paramount, aiming for a high NPS is essential.
Pros:
- Strong correlation with business growth and customer retention: A higher NPS generally translates to increased customer lifetime value and organic growth through referrals. This is especially vital for home service businesses relying on positive word-of-mouth.
- Simple to understand and implement: The straightforward question and calculation make NPS easy to track and analyze.
- Provides a standardized metric for comparison: You can benchmark your performance against competitors and industry averages.
- Identifies promoters who can become brand advocates: Happy customers can be leveraged for testimonials and referrals, further boosting your reputation.
- Predictive of future customer behavior: NPS can be a better indicator of future customer behavior than traditional satisfaction metrics.
Cons:
- Lack of depth without follow-up questions: NPS alone doesn't reveal the "why" behind the score. Following up with open-ended questions is crucial to gather actionable feedback.
- Limited influence of individual call center interactions: While call center experiences contribute to overall NPS, other touchpoints also play a significant role.
- Cultural differences can affect scoring patterns: Scoring tendencies may vary across different demographics, requiring careful interpretation.
- Not always appropriate: NPS may not be suitable for all types of service interactions, especially highly transactional ones.
Examples:
- Apple consistently achieves NPS scores above 70 by empowering its support agents to deliver exceptional customer experiences. This demonstrates the impact of a customer-centric approach on building loyalty.
- USAA maintains NPS scores above 80 in its contact centers through comprehensive agent training and customer-first policies, showcasing the importance of investing in employee development and service excellence.
Tips for Home Service Businesses:
- Combine NPS with "why" follow-up questions: Understand the reasons behind customer scores to identify areas for improvement and replicate positive experiences.
- Measure both transactional and relationship NPS: Gain insights into specific call center performance and overall customer satisfaction.
- Create closed-loop processes to follow up with detractors: Address negative feedback promptly and turn dissatisfied customers into loyal ones.
- Compare NPS across different customer segments and issue types: Identify specific pain points and tailor your service approach accordingly.
- Use NPS to identify high-performing agents: Recognize and reward agents who consistently create promoters, fostering a culture of customer-centricity.
- Track NPS trends over time: Focus on continuous improvement rather than fixating on a single score.
NPS deserves a prominent place in the list of call center KPI examples because it directly links customer loyalty to business growth. For home service businesses, where reputation is paramount, tracking and improving NPS is crucial for attracting new customers and retaining existing ones. By understanding and utilizing this powerful metric, you can drive customer loyalty, generate positive word-of-mouth referrals, and ultimately, achieve sustainable business growth.
5. Service Level/Response Time
Service Level/Response Time is a crucial call center KPI example that measures the percentage of calls answered within a predefined timeframe. This metric, often expressed in the X/Y format (e.g., 80/20, meaning 80% of calls answered within 20 seconds), plays a vital role in evaluating and improving call center efficiency and customer satisfaction. For home service businesses, this KPI is particularly important as timely responses can be the difference between securing a job and losing a customer to a competitor.
How it Works:
Service Level tracks the time it takes for a customer's call to be answered by a live agent. The clock typically starts the moment the customer enters the queue and stops when an agent connects. This data is then aggregated over a specified period (real-time, intervals, or daily averages) to calculate the percentage of calls answered within the target threshold. For instance, if your target is 80/20 and you receive 100 calls, at least 80 of those calls should be answered within 20 seconds to meet your service level goal.
Why it Matters for Home Service Businesses:
In the fast-paced world of home services, customers expect prompt responses to their inquiries, whether it's a plumbing emergency, a broken HVAC system, or a routine maintenance request. A long wait time can lead to frustration and ultimately drive customers to seek service elsewhere. Tracking Service Level/Response Time allows home service businesses to monitor their responsiveness, identify bottlenecks, and optimize staffing strategies to ensure timely service delivery.
Examples of Successful Implementation:
- A national plumbing franchise implemented a tiered service level system, prioritizing emergency calls with a 90/15 target while aiming for 80/30 for routine inquiries. This ensured urgent needs were addressed promptly while maintaining reasonable response times for all customers.
- A local HVAC company, after analyzing their call data, realized their service level was significantly lower during peak hours. They adjusted their staffing schedule accordingly, adding more agents during these high-volume periods and saw a marked improvement in their response times and customer satisfaction scores.
Actionable Tips for Home Service Businesses:
- Set Realistic Targets: While aiming for high service levels is commendable, setting unattainable targets can lead to agent burnout and compromised service quality. Consider your industry, call volume, and staffing resources when defining your X/Y values.
- Segment Your Customers: Different customer segments might have different service level expectations. Prioritize high-value customers or emergency service requests with tighter response time targets.
- Utilize Skills-Based Routing: Route calls to agents with the specific skills needed to handle the inquiry efficiently, reducing call transfer rates and improving first call resolution, ultimately impacting service level positively.
- Monitor Abandonment Rates: Track abandoned call rates alongside your service level. A high abandonment rate coupled with a low service level indicates serious issues with accessibility and response times.
- Use Workforce Management Tools: Implement workforce management software to forecast call volume and optimize staffing levels to meet your service level goals efficiently.
Pros:
- Clear operational target for workforce management.
- Strong correlation with customer perception of service.
- Easy to measure and monitor.
- Helps balance staffing costs with service quality.
Cons:
- Focusing solely on speed can compromise quality.
- Arbitrary time thresholds may not align with customer expectations.
- Can drive undesirable behaviors like premature call termination.
This call center KPI example, Service Level/Response Time, deserves its place in this list due to its direct impact on customer satisfaction and operational efficiency. By monitoring and optimizing this metric, home service businesses can significantly improve their responsiveness, enhance customer loyalty, and gain a competitive edge in the market.
6. Agent Occupancy Rate
Agent Occupancy Rate is a crucial call center KPI example that measures the percentage of time agents spend actively handling customer interactions (calls, chats, emails) compared to their total logged-in time. This metric provides valuable insights into workforce utilization efficiency and is essential for balancing agent productivity with their well-being. For home service businesses, understanding and managing agent occupancy is vital for ensuring efficient scheduling, minimizing customer wait times, and maximizing revenue generation.
How It Works:
Agent Occupancy Rate is calculated by dividing an agent's handle time (including talk time, hold time, and wrap-up) by their total available time (logged-in time). The result is expressed as a percentage. For example, if an agent is logged in for 8 hours and spends 6 hours handling customer interactions, their occupancy rate is 75% (6 hours / 8 hours = 0.75 or 75%).
Why It Deserves a Place in the List:
This KPI offers a direct view into how effectively you're utilizing your agent workforce. For home service businesses, where timely customer interactions are critical for booking jobs and addressing service needs, optimizing agent occupancy can significantly impact the bottom line. By understanding this metric, you can ensure your agents are neither underutilized (leading to wasted labor costs) nor overburdened (leading to burnout and decreased service quality).
Features and Benefits:
- Expressed as a percentage: Easy to understand and track trends.
- Optimal range typically between 75-85%: Provides a benchmark for performance. Note that this range can vary based on the specific nature of your home service business.
- Includes all customer-handling activities: Provides a holistic view of agent workload.
- Can be measured at individual, team, or center-wide levels: Allows for targeted performance improvement initiatives.
- Identifies underutilization or overburdening of staff: Enables data-driven staffing decisions.
- Helps optimize staffing levels and scheduling: Minimizes customer wait times and maximizes agent productivity.
- Indicates potential burnout risk when consistently too high: Protects agent well-being and reduces attrition.
- Supports cost efficiency analysis: Helps optimize labor costs.
Pros and Cons:
- Pros: Identifies underutilization or overburdening of staff, helps optimize staffing levels and scheduling, indicates potential burnout risk, supports cost efficiency analysis.
- Cons: High occupancy may lead to agent burnout, doesn't measure the quality of work, can conflict with other metrics like service level, may encourage agents to extend handle times artificially.
Examples of Successful Implementation:
- TaskUs maintains agent occupancy rates between 80-85% by implementing workforce management software with built-in wellness indicators. This approach could be adapted for a home service business by integrating scheduling software that tracks agent workload and flags potential burnout risks.
- Teleperformance improved agent retention by 25% after optimizing occupancy rates to avoid burnout during peak periods. Similarly, a home service franchise could reduce agent turnover by adjusting staffing levels during high-demand seasons.
Actionable Tips for Home Service Businesses:
- Target different occupancy rates for different times of day or call types: Higher occupancy during peak hours for appointment scheduling might be acceptable, while lower occupancy during slower periods allows for follow-up calls and administrative tasks.
- Monitor correlation between occupancy and quality metrics: Ensure high occupancy doesn't negatively impact customer satisfaction. Track customer reviews and feedback alongside occupancy rates.
- Use skills-based routing to balance occupancy across teams: Route calls based on agent expertise (e.g., scheduling, technical support) to ensure efficient handling of diverse customer needs.
- Schedule appropriate off-phone activities to manage occupancy: Allocate time for training, administrative tasks, and breaks to avoid overworking agents.
- Implement real-time adherence tools to manage occupancy proactively: Monitor agent status and make real-time adjustments to staffing and scheduling as needed.
- Consider occupancy when calculating staffing requirements: Use occupancy data to accurately forecast staffing needs and avoid over or understaffing.
Popularized By: Workforce management pioneers like NICE, Verint, and Aspect, Call Center Staffing Methodology by Penny Reynolds. These resources can provide further insights into optimizing agent occupancy for home service businesses.
Key Call Center KPIs Comparison
| KPI | Implementation Complexity 🔄 | Resource Requirements ⚡ | Expected Outcomes 📊 | Ideal Use Cases 💡 | Key Advantages ⭐ |
|---|---|---|---|---|---|
| First Call Resolution (FCR) | Medium 🔄🔄 | Moderate ⚡⚡ | Higher customer satisfaction, reduced repeat calls 📊📊 | Call centers aiming to improve efficiency & care | Direct link to satisfaction; reduces operational costs ⭐⭐ |
| Average Handle Time (AHT) | Medium 🔄🔄 | Moderate to High ⚡⚡⚡ | Improved operational efficiency, better capacity planning 📊 | Workflows needing time benchmarking & forecasting | Impacts staffing and cost; identifies inefficiencies ⭐⭐ |
| Customer Satisfaction Score (CSAT) | Low to Medium 🔄 | Low to Moderate ⚡⚡ | Direct feedback on service quality and agent performance 📊 | Measuring customer experience per interaction | Simple to implement; provides both quantitative & qualitative insights ⭐⭐⭐ |
| Net Promoter Score (NPS) | Low 🔄 | Low ⚡ | Measures customer loyalty and likelihood to recommend 📊 | Evaluating overall customer loyalty & brand advocacy | Strong predictor of growth; standardized metric across industries ⭐⭐⭐ |
| Service Level/Response Time | Medium 🔄🔄 | Moderate ⚡⚡ | Meets operational targets for call answer speed 📊 | Workforce management and staffing optimization | Clear operational goals; real-time monitoring ⭐⭐ |
| Agent Occupancy Rate | Medium 🔄🔄 | Moderate ⚡⚡ | Balanced agent utilization to avoid burnout 📊 | Workforce utilization and scheduling balance | Identifies over/under-utilization; supports cost efficiency ⭐⭐ |
Optimizing Your Call Center for Success
This article explored six essential call center KPI examples: First Call Resolution (FCR), Average Handle Time (AHT), Customer Satisfaction Score (CSAT), Net Promoter Score (NPS), Service Level/Response Time, and Agent Occupancy Rate. By focusing on these metrics, you can gain a comprehensive understanding of your call center's performance and identify areas for improvement. Remember, the key is to strike a balance between efficiency (metrics like AHT and Occupancy Rate) and quality of service (metrics like FCR, CSAT, and NPS). Mastering these call center KPI examples is crucial for enhancing customer satisfaction, boosting operational efficiency, and ultimately driving revenue growth for your home service business.
To further enhance your call center's performance, it's essential to track and analyze key metrics. The 2025 Customer Service Performance Indicators from Aidlify provide valuable resources and insights. A comprehensive understanding of these customer service performance indicators will allow you to identify areas for improvement and optimize your strategies.
By actively monitoring and managing these KPIs, you can transform your call center from a cost center into a powerful engine for growth. Empower your team, delight your customers, and watch your business thrive. Ready to streamline your call center operations and take control of your key performance indicators? Explore how Phone Staffer can help you automate tasks, improve customer interactions, and optimize your KPIs for maximum impact.