
Calculate Your Sales Conversion Rate
Unlocking clear insights into your funnel starts with a simple ratio: the deals you close divided by the leads you’ve captured, then multiplied by 100. From there, you can zoom in on each handoff—lead to appointment, appointment to sale, and call to sale—to spot exactly where prospects drop off.
Home-service teams often juggle dozen-plus touchpoints. Zeroing in on three core conversion rates makes reporting feel less daunting and points straight to any leaks in your funnel.
Identify Your Core Conversion Events
Each of these metrics follows the same logic: (number of successful outcomes ÷ total opportunities) × 100. Here’s what you’ll track:
- Lead → Appointment: How many of your inbound leads actually book time on the calendar?
- Appointment → Sale: Of those meetings, how many convert into contracts?
- Call → Sale: If you rely on phone outreach, what percentage of calls turn into signed jobs?
Tracking these figures separately shines a light on whether your sales reps need coaching on discovery calls or if your booking process needs a tweak.
Key Conversion Rate Formulas
Below is a quick reference for each stage. Plug these into your CRM or spreadsheet for real-time visibility.
| Funnel Stage | Formula | Sample Calculation |
|---|---|---|
| Lead → Appointment | (Appointments ÷ Leads) × 100 | (50 ÷ 200) × 100 = 25% |
| Appointment → Sale | (Sales ÷ Appointments) × 100 | (20 ÷ 50) × 100 = 40% |
| Call → Sale | (Sales ÷ Calls) × 100 | (15 ÷ 60) × 100 = 25% |
This table turns raw data into a snapshot of funnel health. You’ll immediately see if you’re booking too few appointments or closing at a lower-than-ideal rate.
Interpreting Results And Next Steps
Once you have your percentages, compare them month over month. Are appointment rates climbing but sales lagging? Perhaps it’s time for targeted training on objection handling. If call-to-sale is strong but meetings stall, refine your online scheduler or follow-up reminders.
“Watching each stage separately not only pinpoints problems early but also informs precise fixes—whether in scripts, scheduling, or sales coaching.”
Practical Tips For Fast Setup
- Copy these formulas into your spreadsheet or CRM dashboard for automatic updates.
- Use color-coding or conditional formatting to flag rates that slip below your benchmarks.
- Conduct a monthly review and adjust targets to reflect seasonal demand or campaign shifts.
By routinely monitoring and dissecting these three rates, you’ll turn visibility into action—and keep revenue from slipping through the cracks.
Understanding Conversion Events
Every meaningful conversion rate depends on clear, unique event definitions. Home-service companies juggle everything from online forms to calls and in-person visits.
In practice, a roofing contractor might count a completed inspection request as an event. Meanwhile, a landscaping firm may treat an Instagram photo query as a conversion trigger.
- Website Form Submissions capture first interest
- Phone Inquiries show direct engagement
- Booked Appointments reflect genuine intent
- Completed Jobs seal the revenue deal
Consistent tagging stops leads from slipping through cracks. That way, a conversation that starts in chat and shifts to phone still counts toward your totals.
Tagging Touchpoints In CRM
Start by setting up custom fields or labels for each event in your CRM. Give every source its own code so that forms, calls, and calendar bookings all map correctly.
Use this quick checklist to keep your tagging airtight:
- Define an entry for every touchpoint source
- Standardize channel options with dropdown menus
- Unify terms like “Form Submission” versus “Lead Form”
- Automate status updates as leads move along
- Audit monthly for missing or duplicate tags
When naming is consistent, you can compare data month over month without guessing. Accurate tags mean you see a lead’s path from that first click all the way to the signed contract.
Data from Statista shows how norms evolve over time. The Food and Beverage sector climbed from 0.78% in late 2018 to 3.1% by Q4 2024, while Electronics jumped between 2.83% and 1.86%. An average order value bump of 12.64% can push down your percentage even as revenue grows. Learn more about these trends at Capturly
Defining events precisely is the foundation for any reliable conversion calculation.
Why Uniform Definitions Matter
Alignment on terminology keeps your reports accurate. If one team tags “Booked” as a site visit in April but marks it as a signed deal in May, your metrics will mislead.
That’s why it’s helpful to step back and revisit concepts like the difference between a sales pipeline and a sales funnel. It brings context to where each tag lives.
A routine quarterly audit ensures your labels match the services and channels you actually use. Over time, you’ll trust that a 5% shift means genuine performance movement—not a naming mix-up.
This clarity is what turns raw data into actionable insight.
Applying Sales Conversion Rate Formulas
When you start crunching the numbers, the weak spots in your funnel become crystal clear.
Imagine 200 inbound leads that turn into 50 scheduled appointments—that’s a 25% lead-to-appointment conversion. Then, if 20 of those appointments become paying jobs, you’ve hit a 40% appointment-to-sale rate.
- Lead → Appointment: (Appointments ÷ Leads) × 100
- Appointment → Sale: (Sales ÷ Appointments) × 100
- Call → Sale: (Sales ÷ Calls) × 100
Pull raw data from Google Analytics goal reports and your CRM logs, then layer in call records from your phone platform. This combined view ensures you capture every interaction and pinpoint where prospects drop off.
Calculating Funnel Stage Rates
Breaking down each stage shows exactly where to focus your energy. A local home-service team, for instance, analysed 60 calls and closed 15 of them—giving a 25% call-to-sale rate. That immediately flagged the need to refine their call script and follow-up routine.
| Stage | Raw Data | Rate |
|---|---|---|
| Lead → Appointment | 200 leads → 50 appts | 25% |
| Appointment → Sale | 50 appts → 20 jobs | 40% |
| Call → Sale | 60 calls → 15 jobs | 25% |
Compare these numbers month over month to highlight trends or sudden dips. Let the data guide you toward the stage that needs the most attention—whether it’s prospecting, booking, or closing.
Tracking Benchmarks And Variance
Our 2025 benchmarks put the average funnel conversion at 2.35%, with top performers reaching 5.31%. Legal services often hit around 7.4%, while e-commerce sits near 1.84%, reflecting shorter cycles and lower price points. These disparities make it essential to monitor each step and tackle bottlenecks early.
“Benchmarks give you a reality check, shining a light on stages that lag.”
Explore the full data set in the Amraandelma funnel conversion research.
If your appointment-to-sale rate slips below 40%, sharpen your proposals and objection-handling scripts. Anything under the 2.35% average demands a fresh look at your prospecting and follow-up strategy.
- Measure each stage against the 2.35% benchmark and your internal goals.
- Pinpoint underperforming steps for rapid improvement.
- Use a monthly dashboard to flag anomalies and celebrate gains.
Building A Tracking Template
Kick off with a simple spreadsheet. Include columns for Leads, Appointments, Calls, Sales, and Conversion Rate. Enter formulas like =(B2/C2)*100 to auto-calculate percentages.
- Freeze the header row to keep labels in view.
- Add dropdown menus to standardize status entries and cut down on typos.
- Link your CRM exports for a seamless, weekly data refresh.
With this template, leaks stand out instantly—and you’ll have clear reports to share with your team.
Maintaining Team Alignment
Make conversion metrics a regular agenda item. A quick look at appointment-to-sale improvements—especially when you break past 40%—builds real momentum.
When a marketing push or seasonal shift moves your baseline, reset targets and keep everyone in sync.
“Consistent tracking turns raw data into strategic decisions that fuel revenue growth.”
Armed with these formulas and your tracking template, you’re set to monitor every step of the funnel. Automate those weekly exports, share dashboard links with stakeholders, and stay on top of each metric.
Focus on each stage. Celebrate small wins. Tackle leaks as soon as they appear. Now watch those numbers over the next quarter—you’ve got this.
Comparing Industry Conversion Benchmarks
It’s natural to wonder how your rates stack up. Across plumbing, HVAC and landscaping, you’ll typically see conversion figures between 2% and 4%.
In my experience, plumbing teams hover around 2.7%, with the best pushing 3.5%. HVAC outfits average 2.5%, and strong markets can hit 3.8%. Landscaping crews often land near 2.2%, while their top performers reach 3.1%.
Industry Conversion Rate Comparison
Below is a snapshot of average and top-tier results in key home-service verticals.
| Industry | Average Conversion Rate | Top Performers |
|---|---|---|
| HVAC | 2.5% | 3.8% |
| Plumbing | 2.7% | 3.5% |
| Landscaping | 2.2% | 3.1% |
These numbers give you a starting line. Compare your own data against them before setting goals.
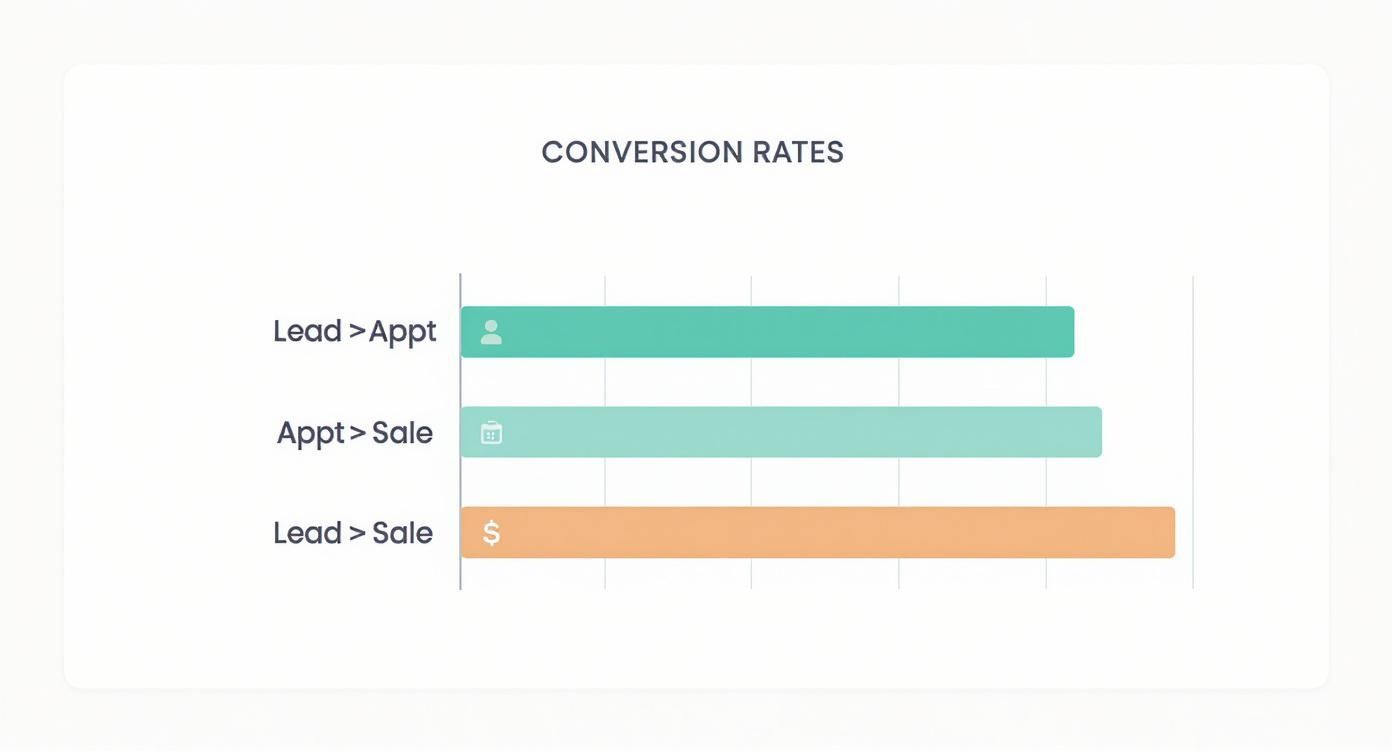
A quick glance shows Lead→Appointment conversions outperform Appointment→Sale by roughly ten points. That drop tells me follow-up and scheduling need extra attention.
Globally, Invesp reports a 2.35% baseline—similar to Statista and Shopify insights. Countries like Germany, the UK and the Netherlands often reach 3.5%, whereas emerging regions trend closer to 2%. Learn more about these global e-commerce conversion rates.
Device choice also matters. Desktop users generally convert at higher rates in home services, though mobile is catching up among younger homeowners.
Setting Realistic Targets
Before you lock in your monthly goals, factor in:
- Your local desktop vs. mobile split
- Seasonal demand swings in your service area
- Peer benchmarks in your state or metro region
“Real data comparison cuts out guesswork and drives pinpointed improvements.”
Once you’ve mapped where you stand versus the benchmarks, you can drill into the stages falling short—whether that’s initial lead response or closing the sale.
Channel And Device Guidance
Different channels drive distinct conversion outcomes:
- Organic search usually converts 1.5–2.5% on service sites
- Paid search can nudge that to 3%+ with precise targeting
- Social campaigns hover around 1% but build long-term awareness
If desktop leads the way, prioritize desktop-optimized pages. If mobile traffic dominates, simplify forms and add tap-to-call buttons.
Regularly revisit these benchmarks—quarterly check-ins help you update goals and sharpen tactics as your market evolves.
Implementing Tracking Best Practices
Getting conversion metrics right depends on having clean, reliable data in your CRM and analytics platforms. When every lead is logged correctly, you can focus on what moves the needle instead of patching holes in your numbers.
Consistent touchpoint tagging keeps appointment, call, and deal counts rock-solid:
- Define Unique Event Names for forms, calls, and onsite visits to avoid overlap.
- Lock Inputs Behind Dropdown Fields in your CRM to prevent typos.
- Automate Tagging with workflows that reduce manual work.
- Audit Logs Weekly to spot duplicates or missed events before they skew reports.
Tools For Solo Operators
A solo operator can get up and running without breaking the bank. Free analytics plugins for WordPress handle goal tracking in minutes.
Adding a lightweight call-tracking script captures inbound numbers and ties them back to your conversion data.
Consistent tagging and tracking eliminate guesswork and ensure every lead is counted.
Automated Alerts And Data Consistency
I spoke with a home-service owner who set up alerts to catch duplicate entries within hours. That tweak slashed data-cleanup time and kept monthly reports airtight.
Use this checklist to safeguard data health:
- Enable email alerts for missing event values.
- Flag unusually high activity with threshold triggers.
- Automate a report that highlights zero-conversion events.
Now, take a quick peek at goal tracking in Google Analytics.

The screenshot shows how to configure goal tracking in Google Analytics using event categories and actions. Aligning these labels with your CRM tags is the secret to unified reports.
For a deeper dive into lead scoring and management, explore our guide on best lead management software: https://phonestaffer.com/blog/best-lead-management-software
Integrating Paid Advertising Tracking
Paid ads can flood your funnel—if you know exactly where every click lands. Dig into Google Ads best practices for conversion tracking to fine-tune your setup.
Keep paid leads from slipping through with these steps:
- Map UTM parameters from each ad into CRM fields.
- Tag events like Appointment Booked and Invoice Sent to capture late-stage conversions.
- Review channel performance in your CRM dashboard on a weekly and monthly basis.
Scaling For Larger Teams
As your team expands, you’ll need platforms that integrate call tracking, CRM events, and analytics seamlessly. Here’s a quick comparison:
| Tool | Best For |
|---|---|
| Free Analytics Plugin | Solo operators |
| Integrated Call Platform | Teams handling 500+ calls/mo |
At that scale, look for solutions with open APIs so calls, appointments, and sales sync in real time.
Standardized training and clear SOPs ensure everyone tags events the same way. Regular review cycles catch drift before it causes confusion.
- Document every change in tracking setup.
- Schedule quarterly data audits with stakeholders.
- Keep naming conventions consistent every month.
Data integrity is the backbone of actionable conversion insights.
When you guard your data at every step, your sales conversion-rate reports finally reflect reality—and point you straight to your next growth move.
Avoiding Common Conversion Pitfalls
Tracking conversions might seem straightforward, but small mistakes can throw off your entire analysis. Even experienced teams sometimes let duplicate entries or loose definitions slip through the cracks, skewing every percentage.
Here are the usual suspects that erode accuracy:
- Duplicate Leads: Quickly merging or purging repeats stops your totals from ballooning.
- Unclear Event Names: Consistent labels like “Appointment Booked” keep everyone on the same page.
- Offline Touchpoints: Manually log phone calls and in-person inquiries so no interaction vanishes.
- Misaligned Periods: Match your reporting window with campaign dates to ensure apples-to-apples comparisons.
- Small Sample Bias: If you’re working with fewer than 30 records, hold off on sweeping conclusions.
These little hiccups may look harmless, but they can mask your real bottlenecks and throw off your sales conversion rate.
Establishing Lead Capture Procedures
A clear, consistent intake process is your first line of defense against messy data. When every team member follows the same steps, you’ll eliminate confusion and fill gaps before they appear.
• Require fields such as lead source, date, and event type on every form.
• Let your CRM flag potential duplicates automatically.
• Reserve time each week to scan for missing entries or overlapping records.
Accurate data entry is the foundation for reliable conversion reports.
With these practices locked in, your dashboards will finally reflect true performance levels.
Quick Wins To Improve Conversion
Sometimes the smallest shifts deliver the biggest impact. Take reminders, for instance—tweaking their timing can lift appointment show rates by 15%.
- Send two reminders: one 48 hours out, another 2 hours before the appointment.
- Sharpen call scripts with targeted questions that preempt common objections.
- Experiment with email subject lines in A/B tests to boost opens and clicks.
Minor tweaks in reminders, scripts, and testing often yield an immediate uplift.
Apply these tactics at each funnel stage, and you’ll uncover hidden opportunities to accelerate your sales.
Maintaining Consistent Practices
Data integrity isn’t a one-and-done task. Regular checks and ongoing training keep your entire team aligned and your metrics trustworthy.
- Refresh your SOP document every quarter.
- Use weekly team huddles to reinforce naming conventions and logging steps.
Consistency transforms clean data into a solid basis for growth projections. Keep up the rhythm, and your conversion rates will stay healthy for the long haul.
Conversion Rate FAQs
If you’re juggling phone calls, web forms, and live chat, every interaction counts. Start by mapping each inquiry source in your CRM and tagging them accordingly.
- Calls logged with exact timestamps let you match conversations to outcomes.
- Form submissions give you a clear record of booked appointments.
- Chat messages capture customer intent as it happens.
Recalculation Frequency
It’s best to recalculate your conversion rates on a monthly basis. That way, any emerging pattern is easier to spot.
A quick weekly snapshot can also reveal sudden dips—especially after a fresh marketing push.
Accurate, timely recalculation avoids guesswork.
Choosing Reliable Benchmarks
Industry averages offer a useful starting point. Aim for an overall 2.35% conversion, with specific targets like 2.5% for HVAC and 2.7% for plumbing.
- Adapt these figures to reflect your local market’s quirks.
- Cross-check this month’s rate against the same period last year to strip out seasonality.
Compare winter booking rates for roofing with past winters versus summer peaks.
Seasonal Adjustments
Frame your reports year-over-year so you’re comparing apples to apples. Highlight peak months and quieter stretches on your team calendar. Adjust goals so a December downturn in landscaping calls doesn’t set off false alarms.
Offline Touchpoints
Don’t let face-to-face inquiries slip through the cracks. Keep a simple log or mobile app synced to your CRM. This way, every quote and walk-in gets counted toward your true conversion rate.
Get dedicated call support and appointment booking for home services with Phone Staffer: Phone Staffer